Question 1: How old are you are?
This question was firstly used as a starter question to discover the ages of people and see if there could potentially be a link between the popular age and there answers. For example, will certain age groups like different things? For this and all the questions I used a pie chart because I felt that this chart was the best to use as it is very statistical.
Of the 20 people used in my questionnaires, a staggering 60% were 17. This promptly let me knew the popular age of the questionnaire. 6 people were 16 years old while 2 people were 18. The questionnaire was distributed to mostly random around college so there was no bias used.
From the analysis of this question, its turns out that 60% (12) were female and 80% (8) were male.
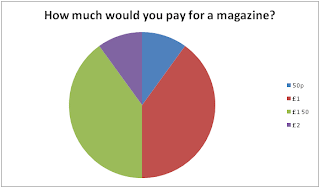
Question 3: How much would you pay for a magazine?
This question was put in the questionnaire to see people’s general opinion on how much they would pay for the magazine. For example, would they pay less or would they pay more? This question is crucial because from here I will be able to model a price plan for the target consumer.
Of the 20 people 30% percent thought the price should be £1; another 30% thought the price should be £1.50. 20% thought the price should be 50p and another 20% thought the price should be £2. The results of this question are ambiguous meaning there is no clear popular price that I should use a model price
Question 4: What kind of topic would you want in the magazine?
This question was produced just like question 3 to see student’s general opinions about certain questions they would prefer to read about in the magazine. This question is just as crucial because data from the question will be used to model my premilary magazine.
The results of this question suggests i should include a part about film and music at the same as the result between the two answers was very close with 45% of people surveyed preferring film and 30% of people preferring music.
Question 5: How often should the magazine be published?
I used this question to see people’s reaction to the publication of a magazine. For example, would students like the magazine to be published frequently or would they like to see the magazine published rarely?
The results suggests most people would like to see the magazine published only once a month as nine people ticked that corresponding answer. 6 people thought it should be once a term and another 5 thought it should be once a week.
Question 6: Would you like a university section?
This question was one of the first opinionated questions used in the questionnaire. I used this question to work if my target audience was keen on going to university or if they were not.
The results show that 12 people wanted a university section in the magazine while 8 people did not want there to be a university section. The subsequent results may affect the magazine as I may choose to include a university section or may not.
Question 7: Would you like the magazine to include a part about college exams?
This question was used to see if students wanted a section or little reminder about college exams. The results were:
75% (15 people) of the populated wanted a little section about college exams. I may be forced to include this as a section because of the high demand for it.
Question 8: Would you like the magazine to offer freebies?
This question was used as bait to attract potential target consumers into purchasing a magazine
85% of people wanted the magazine to offer freebies which could help me to model a magazine for my target audience.
Question 9: Would you like the magazine to include a part about enrichment?
This question was used as a closed question to see peoples fixed opinions on the enrichment programme.
13 people did not want a part about enrichment which could connote the lack of urgency about the topic.
Question 10: Would you be interested in subscribing to the magazine?
Just like the previous four questions the question was a closed question to see if people were interested in subscribing in the magazine if it became a success. The results were:
80% of the people asked were not keen on subscribing to the magazine while 20% were keen on subscribing to the magazine. This could be due to the expensiveness of subscribing to magazines.
Question 11: Do you read magazines regularly?
This question was produced so that I could know if the people who I was questioning actually read magazine because they would be no point in using there data if they did not read magazines at all. The subsequent results were:
All 20 people interviewed read magazines which was a joy because I would able to use there data to potentially model a model magazine for the target audience.
Question 12: what would you include in the magazine to make it suit your individual needs? (Please State)
For my final question, I was unable to produce a chart because of the openness of the question used. However I did have a range of answers. Answers ranged from ‘Extreme Sports ‘to ‘Exam Tips’. I asked this question to see if I could maybe sneak in a little section about a topic that more than one person wanted included however everyone’s answer completely different to the other person .
Question 2: What gender are you?
This question was used in purpose to know peoples gender and to see just like the 1st question to answer if there was a common link between the popular gender and its answers. I.e. would there be more males than females who answered this questionnaire or vice versa?


